What is the optimal mix of R40th?
Building an efficient curve leveraging public software data to compare different software stages of growth and profitability.

Rule of 40th1 has been a very useful and well-spread indicator to measure more late-stage or bootstrapped software companies that are already at +1M ARR levels.
However, it gets complicated (as an investor or founder) whenever you’re trying to compare how you are doing vs. other peers or to set your own expectations of what would be a good mix.
In a time in which valuations have been correlating with growth and efficiency instead of growth on a standalone basis, it becomes useful to test how far or close you are from a basket of similar assets.
Even though private data might not be available for all, the public markets offer opportunities to gather information from similar asset classes and build your own way to evaluate and create a base rate.
In our case, we selected those that are performing close to this efficiency line and segmented them by a different mix of R40th2.
Regardless of your revenue size, we may extrapolate an efficiency curve. Where the mindset is to evaluate efficiency into different stages of growth and profitability of assets within the R40th line.
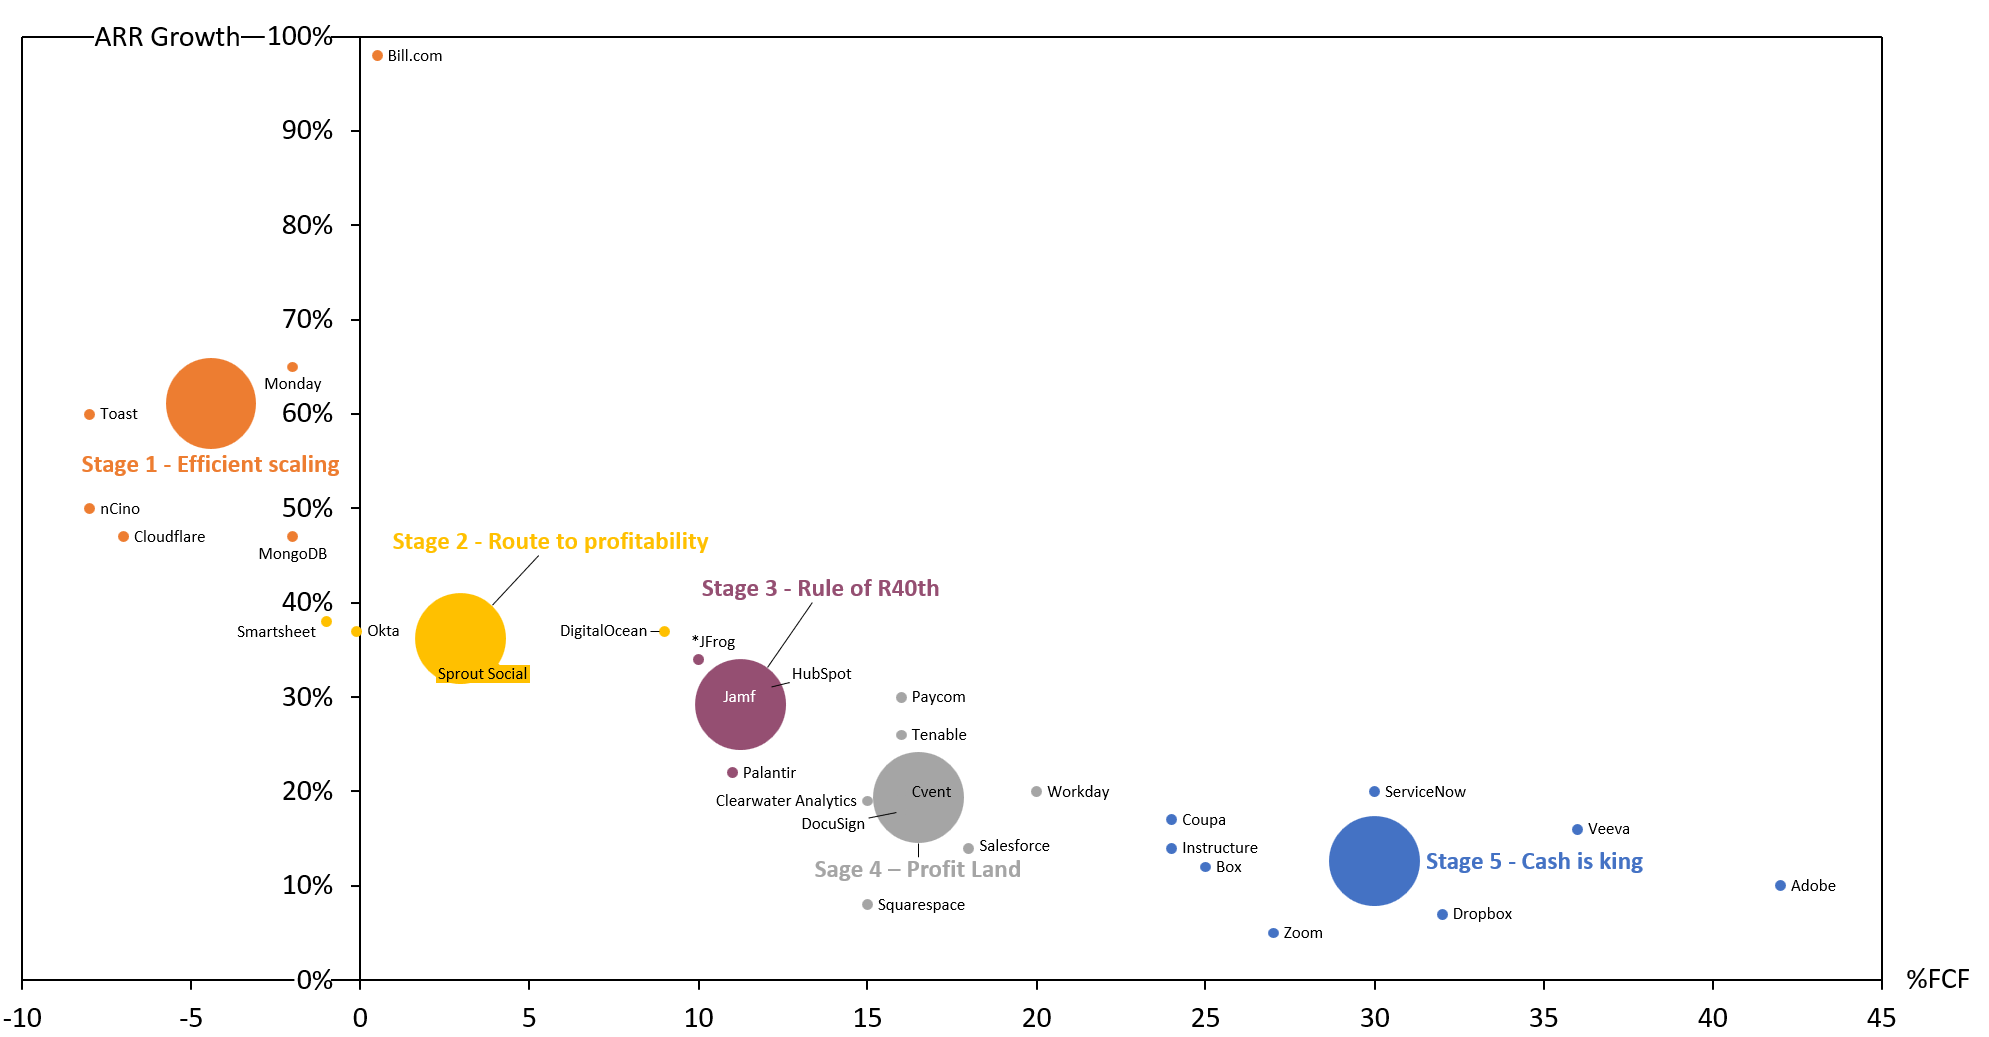
We have segmented our efficiency line by growth x FCF stages:
Stage 1 [Efficient Scaling]
Usually, younger companies have just gone out publicly by demonstrating “quality of growth” or selling a path to profitability narrative.
Stage 2 and 3 [Route to Profitability and R40th]
Growth will inevitably mature for bootstrappers or public companies, either by choice (re-investment levels in organic growth) or market penetration.
The latter will be challenged by increased S&M investments to keep growth levels while public companies look for potential operating leverage gains in COGS, R&D, or G&A.
Stage 4 and 5 [Profit Land and Cash is King]
As companies get bigger, growing at the same pace becomes more challenging.
However, S&M costs from new sales will drop (upselling to the current base will bring the majority of revenue growth) strengthening their ability to further optimize and generate cash.
Mathematically speaking, the Rule of 40th will give equal weight to growth and free cash flow margin. In reality, growth carries more weight in driving valuation than free cash flow margins for a given 100 bps change in either.
Here is an example3: Assuming a company with $100 in revenue, a 20% FCF margin, a cost of equity of 10%, and 5% growth in perpetuity. The fair value of this company is $400. A 1% increase in growth drives the fair value to $500, while a 1% increase in FCF margin results in a fair value of $420. The gap between the higher intrinsic value from an incremental percentage from growth vs margin will increase the lower the cost of equity is.
In cheap capital times, growth will be more valuable and when expensive as of today it will be less, but still, growth will continue to have a bigger weight and will be much more appreciated as long as the mix is healthy.
Organic Growth + U-FCF (often miscalculated for EBITDA, which leads to incorrect measurements as not all companies share the same tax, intangible capitalization, or working capital efficiency). U-FCF stands for FCF before interest is paid.
There isn’t a sufficient correlation between all assets, and our goal here is to extrapolate an efficiency line (vs. building statistics). It’s a reality check to test and budget for efficiency.
The example holds true whenever the company already has a minimum FCF percentage. If its too low, the improvement of 100bps of FCF outweighs.